Insights into International App Performance
15 Apr 2015
Eric Fram
This article was originally posted on ZippyBrain.com on April 15, 2015. Link
If you want to try this analysis with your own data, I’ve created some guides to help you follow along.
- If you get your revenue and downloads data from iTunes Connect: click here
- If you get your revenue and downloads data from App Annie: click here
Or just jump straight into the files on Github. Link
Introduction
When we release a new app to the App Store, we typically release it simultaneously in all territories worldwide. The App Store functions in dozens of countries, and Apple makes it very easy for developers to take advantage of their international reach. Since our apps contain only original content, we are not bound by any international licensing agreements that limit our distribution area (as would be the case if we were say, distributing television shows). Even if our non-localized apps don’t perform well in non-English-speaking territories, that’s not a reason not to release it everywhere. Apps don’t have marginal cost and there is always the (slim) chance that an app will go viral in a certain country. Virality is not yet something we can predict, so we have been using the shotgun approach. We’ve released several apps now, and have collected a fair amount of international downloads and revenue data. My goal here is to compare performance of different apps by territory to see if there are any specific places where we can target our apps and marketing efforts to achieve outsize returns.
There are a few caveats. We monetize our apps in several ways, including in-app purchases, iAds, AdMob ads, and Vungle video ads. Most of our apps use more than one of these platforms. Unfortunately, we are not able to break down Vungle revenue based on territory, so I will do not include any revenue from that in this analysis. Additionally, iAds and AdMob generate very different levels of revenue, so comparing our apps that use iAd with our apps that use AdMob might skew the results. For this analysis, I am only including in-app purchase and iAd revenue in order to ensure that comparisons between apps are valid.
Some territories show zero revenue. In these territories, no one has purchased an in-app purchase and iAds cannot be served (or they could not be served for most of the app’s lifetime). Right off the bat we can conclude pretty safely that it is not worth any additional effort to promote our apps in territories that are likely to generate zero revenue.
Fight the Fire
To kickoff this analysis, I decided to examine the downloads and revenue data from our most recent “big” app, Fight the Fire. Fight the Fire is a strategy game where players deploy firefighting resources to put out wildfires. The app has been downloaded in over 50 countries so far, but players are mostly concentrated in English-speaking countries. We have not localized this app for any other markets, so that was not surprising. Figure 1 shows the top countries by total percent of downloads and total percent of revenue.
<img class=”size-full wp-image-1682” src=”http://zippybrain.com/wp-content/uploads/2015/04/FtF-Rev_DL1.png” alt=”Figure 1 -Fight the Fire Downloads and Revenue by Territory (Tools: R, ggplot2, Illustrator)”a> Figure 1 - Fight the Fire Downloads and Revenue by Territory (Tools: R, ggplot2, Illustrator)
The United States dominates these rankings. I expected this. 100% of our marketing efforts are focused in the United States, and it is also the largest English-speaking app market. The next three top markets by downloads are the other English-speaking markets: the UK, Australia, and Canada. Looking at the revenue data, we can see that downloads in the United States and Australia outperformed downloads in other countries by revenue. Downloads in those territories were much more valuable. To see this disparity more clearly, I created a metric, relative download value, which is the ratio of the percent of total revenue to the percent of total downloads by territory. This metric allows me to quickly compare how relatively valuable downloads are between territories. I’ve graphed this metric in Figure 2.
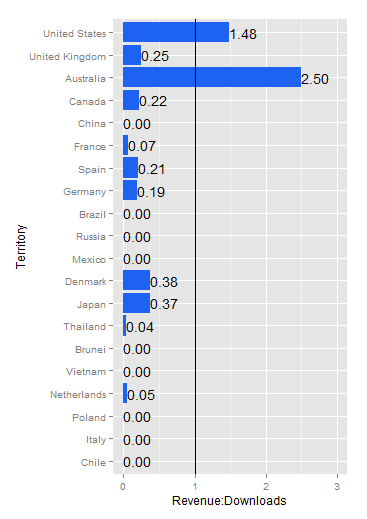
Figure 2 - Fight the Fire Relative Download Value by Territory (Tools: R, ggplot2)
If territory were to generate 10% of total downloads and 10% of total revenue, its ratio using this metric would be exactly 1. Any country with a relative download value ratio greater than 1 overperformed relative to their downloads, and any country with a ratio less than 1 underperformed. Looking at this chart, we can clearly see just how much Australia over-performed. At a glance here, it looks like Australia might be a prime place to focus our marketing efforts in the future. It may be the case that Australians just love to spend money on the App Store. It could also be possible that since Australia has a lot of wildfires, an app about putting them out resonates well with users there. We’ll need to look at data from other apps before drawing any conclusions.
Another point to note in this data is that downloads in Denmark and Japan were both relatively more valuable than downloads from the UK and Canada. Perhaps these territories should be at the top of our list for localization in future apps. Again, it will be useful to look at data from some of our other applications before making any conclusions.
Beehive Blast
The last game we released before Fight the Fire was a simple arcade game called Birds vs. Bees: Beehive Blast. It’s been on the market for a while now, and like Fight the Fire, been downloaded in about 50 countries. Look at Figure 3 to see downloads, revenue, and the relative download value metric.
 Figure 3 - Beehive Blast Downloads, Revenue, and Relative Download Value (Tools - R, ggplot2, Illustrator)
I was surprised at just how different this data is from the data for Fight the Fire. The US still dominates, but Denmark and China have crept into the top four territories by downloads, surpassing Canada and Australia. The relative download value by territory is also wildly different: the US performs solidly, but Australia’s performance now lags hugely behind. Also, despite Denmark and China’s high rankings on the downloads list, they generate nearly no revenue. Beehive Blast contains very little text, so it may be more accessible to users who don’t speak English.
Since Denmark’s relative download value for Fight the Fire was about 0.4, and for Beehive Blast drops to nearly 0, my suggestion that it might be a prime target for future localization doesn’t seem like the greatest idea anymore. Perhaps something about Beehive Blast’s App Store page resonated with Danes, but the actual game did not. Japan is a similar story.
The big outlier here is Italy, which massively outperformed every other country with a relative download value of 6.25. Since downloads in Italy never really did take off, I’m inclined to attribute this overperformance to a small group of competitive Italians who got really into the game and started to spend money on it, but who were not successful in making the game go viral in their community.
Puznetic
Puznetic is one of our earlier apps, and is, you guessed it, a puzzle game. It is a riff on the classic jigsaw puzzle with some added physics challenges. See Figure 4 for the data. The data for this app is weaker than for the other ones, as it was less popular than either Fight the Fire or Beehive Blast.
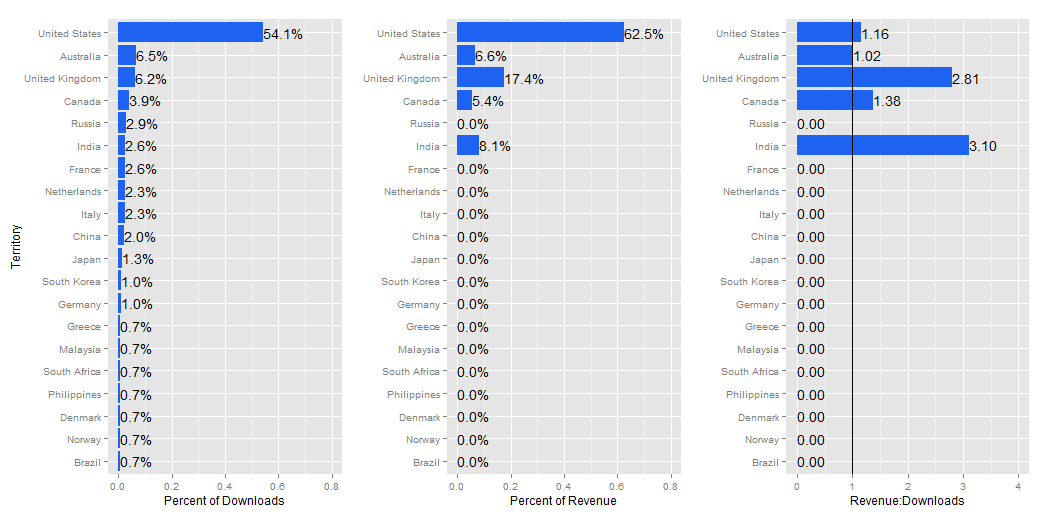 Figure 4 - Puznetic Downloads, Revenue, and Relative Download Value (Tools - R, ggplot, Illustrator)
Just like with Fight the Fire, the four English-speaking markets take the top spots on the downloads ranking. In a surprising twist, India has generated more revenue than either Australia or Canada. Its relative downloads ranking is very high, along with the UK’s. Jigsaw puzzles are an especially popular hobby in the UK, so British people who play Puznetic may be more likely to spend longer playing the game. We show ads in the free version of Puznetic, so the longer people play the game, the more revenue the ads generate. I can’t find any information (in English at least) indicating that Indians have a particular love for jigsaw puzzles, but perhaps, like cricket, the British spread that hobby to India centuries ago.
What does this mean?
Taking all this data together as a whole, there are a few conclusions we can make.
1- Focus on the United States
While the specifics for other countries vary from app to app, the United States is always at the top of the downloads and revenue rankings. Its relative download value metric has also never dipped below 1. I don’t think that this dominance is solely because the United States is the largest English app market. Zippy Brain apps are made by Americans and tested by Americans, so it may be that we end up making games that Americans want to play. In some cases, we’ve been lucky to strike a chord with users in other countries, but we can’t do it consistently.
2- English-speaking Territories Come Next
Other than the United States, the world’s other big English-speaking markets consistently rank near the top of our downloads and revenue list. They generally perform well on the relative download value rankings as well. Our apps are in English, so it is not a surprise that English-speakers are our top customers. I intend to focus the majority of our marketing efforts in the United States, but it may be worthwhile to do at least some marketing activity in these other markets, if only to collect some better marketing analytics data. Regarding localization: it’s a time-consuming process and is something we will only really consider once we have a huge success in English markets.
3- We Need More Data
When I started this analysis, I was hoping to find some underappreciated magic territory which consistently overperforms. That does not seem to be the case. We can make a reasonable guess that Australians are interested in fighting wildfires, or that British people really love jigsaw puzzle games, but we really need to look at data from a range of similar apps in order to make solid conclusions. As we release more apps and collect more data, the quality of our information is always improving. For now, we’ll keep out efforts focused on the US.
I hope you’ve enjoyed reading this! As I consider this information some more, I will continue to update my conclusions. This post is the first in a series on posts about our data insights. Please feel free to send us an email with any questions or tweet at us @ZippyBrain. If you want to play any of these games, they are all free! Downloads links are on our home page.