Comparing App Performance by Monthly ARPU
20 Apr 2015
Eric Fram
This article was originally posted on ZippyBrain.com on April 20, 2015. Link
There are a huge variety of monetization strategies available to mobile application developers. Not only do we have to design apps in such a way as to get users to actually spent their time and money, we have to make important decisions about how to integrate ad platforms and in-app purchases (IAPs) in effective ways. My goal with this analysis is to examine which of our monetization strategies is most effective in order to make better decisions for future applications.
Once we have implemented our monetization strategy into an app and released it into the marketplace, we can determine how effective our strategy is by measuring that app’s average revenue per user (ARPU). ARPU is one of the most important metrics for measuring the success of an app, since it allows us to validate our designs and to calculate acceptable user acquisition costs. For this analysis, I use one month are the standard unit of time for comparison of ARPU. For the rest of the article, I call this MARPU (monthly average revenue per user). For a given month and a given app, I calculate the MARPU as (Total Number of Active Users) / (Total Revenue from All Sources).
So if one of our apps has 1000 active users in a given month, and those users generated $100, then the MARPU would be $0.10. Using this metric, I can compare changes in how much revenue we generate per user between apps and across time. For this analysis, I will compare MARPU for our four most successful iOS apps to date (excluding Earth Day Carol, which is a non-commercial project and generates no revenue). These apps are Battle for the Birdhouse, Beehive Blast, Fight the Fire, and Helitack, all of which are free to play.
Here's a quick summary of what strategies and platforms we use in each of these apps:
- Battle for the Birdhouse - iAd banners, incentivized Vungle video ads
- Beehive Blast - iAd Banners, incentivized Vungle video ads, consumable in-app purchases
- Fight the Fire - iAd Banners, incentivized Vungle video ads, consumable and non-consumable in-app purchases
- Helitack - AdMob interstitial ads, incentivized Vungle video ads, non-consumable in-app purchases
I encourage you to try these apps out for yourself to see exactly how we have implemented our strategies. Download links are on our home page. We have experimented with several different platforms and strategies so that we could see what actually worked best. To be fair, the success of our monetization strategies have less to do with the specific platforms we use, and more to do with the design of the apps. I do consider this in my analysis.
Figure 1 shows MARPU over the lifetime of all of these apps, broken down by app. Instead of showing our actual MARPU figures, which are something I would like to keep private at this time, I have instead created a MARPU Index. In this index, 100 is the index value for MARPU of Battle for the Birdhouse in its first month on the market. As an example, if Battle for the Birdhouse hypothetically generated 10 cents per user in April of 2014, and that data point has a MARPU Index of 100, then Helitack's MARPU Index of 300 in November 2014 would mean that each user of that app generated 30 cents on average that month.
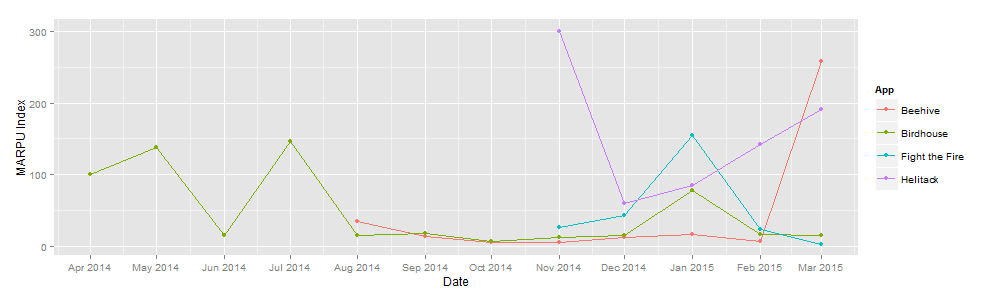 Figure 1 - MARPU Index over time by app (Tools: R, ggplot2)
When I first calculated this information, I expected to see that MARPU values were different across apps, but was surprised to see how much our MARPU fluctuated from month to month within each app. As I will show later, some (but not all) of this volatility is because of groups of in-app purchases. None of our apps have been wildly successful at convincing users to buy in-app purchases, but some users do. It seems to be the case IAP revenue comes in spikes, where some group of users will buy several IAPs within a short period of time. I suspect that we are only seeing this effect because of our relatively small pool of paying users. The rest of this volatility is because the eCPMs from ad platforms vary a lot over time.
It is encouraging to see that our newer monetization strategies seem to be improvements on our old ones. To get a better look at our MARPU, I aggregated all the data for each app into an average lifetime MARPU. Figure 2 shows this information. As before, I use an index to obscure our actual figures. This index starts at 100 and uses our worst-performing app’s lifetime average MARPU as its base. In this case, it’s Beehive Blast, which unfortunately performed worse than its predecessor.
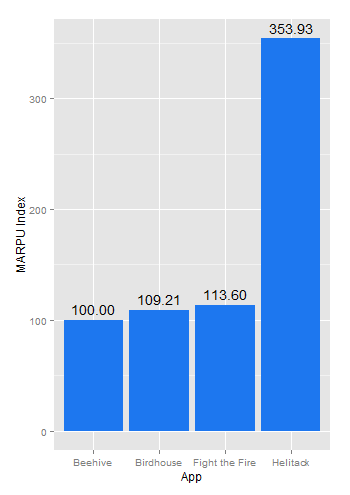
Figure 2 - Indexed average lifetime MARPU by app (Tools: R, ggplot)
The big winner here is our most recent release, Helitack. Users of Helitack on average produce 3.5 times more revenue per month than users of Beehive Blast. It is encouraging to see our MARPU on an upward trajectory like this, but Helitack was unfortunately not very good at getting users to actually buy IAPs, especially compared to Fight the Fire. How was it doing so well?
To narrow down the focus on exactly why Helitack was generating such superior MARPU numbers, I decided to compare MARPU across apps again, but this time to exclude all in-app purchases. Figure 3 shows MARPU over time excluding IAP revenue (so, only including advertising revenue).
 Figure 3 - MARPU index over time by app excluding app IAP revenue (Tools: R, ggplot)
When we compare only advertising revenue, Helitack’s numbers look even better! Figure 4 makes the comparison between Figure 3 and Figure one even easier. You can see that IAP revenue is not significant for Helitack.
 Figure 4 - Figure 1 & Figure 3 comparison (Tools: R, ggplot, Photoshop)
As before, I aggregated the MARPU data from Figure 3 into a single chart that allows us to compare average advertising revenue per user over the lifetime of each app. Figure 5 shows this data, and the MARPU is once again indexed to our worst-performing app.

Figure 5 - Indexed average lifetime MARPU by app, excluding IAP revenue (Tools: R, ggplot)
Helitack’s comparative lead increases even more if subset the data in this way. Each user generates more than ten times as much advertising revenue per month on average! But why? My first guess was that users were spending a lot more time playing Helitack, and so were generating a lot more impressions and thus a lot more revenue.
I checked our usage figures and found out that the overall median number of sessions per month is almost exactly the same for all of our apps. When comparing the median length of those sessions, Helitack actually comes in dead last. How can Helitack possibly generate the highest MARPU numbers with the lowest amount of time spent per user in the app?
The answer is AdMob interstitial ads shown at the end of each game round. They generate greater than 90% of Helitack’s total revenue. I’m hesitant to publish the actual eCPM numbers we are getting, but the revenue AdMob interstitials provide, at this time, is completely blowing everything else out of the water. You can see from Figure 3 above that the exact amount varies a lot from month to month, but it still compares very well. It is possible that this will change in the future (so we’ll keep an eye on our figures), but after looking into this, I can say that we will definitely be using them in future apps.
I can’t say for sure that AdMob will perform this well for you in your apps, but based on our data, I would definitely say they are worth trying out. We will continue to experiment with other strategies, and will post our updated results in the future.
TL;DR - AdMob interstitial ads are really killing it for us
If you have any questions, feel free to email me at info[at]ZippyBrain.com or tweet me @ZippyBrain.