Insights into International App Performance, Part 2
27 Apr 2015
Eric Fram
This article is a follow-up to ‘Insights into International App Performance’ and was originally posted on ZippyBrain.com on April 27, 2015. Link
A couple weeks ago, I wrote an article comparing the relative value of our apps’ international downloads. I had hoped to find a specific territory where revenue-per-download was consistently above average so that we could focus some of our marketing efforts there. After looking at revenue data from three of our apps (Fight the Fire, Beehive Blast, and Puznetic), I came to the conclusion that the territory I was looking for was in fact the United States. I encourage you to at least skim that article before you keep reading.
Last week, I published an analysis of our different monetization models. I found out that the average monthly revenue per user (ARPU) in our most recent app, Helitack, is more than three times higher than in any of our other apps.
After this discovery, I had to examine which territories Helitack’s revenue comes from. As before, I looked at which territories generated what percentage of Helitack’s downloads and revenue. I then calculated a “relative download value” metric (the ratio between the percent of total revenue and percent of total downloads by territory). Helitack generates revenue from in-app purchases (IAP), AdMob interstitial ads, and Vungle incentivized video ads. Since we can’t break down Vungle revenue by territory, this analysis only includes IAP and AdMob revenue. As I mentioned in my previous article, more than 90% of Helitack’s total revenue comes from AdMob. Figure 1 shows the results.
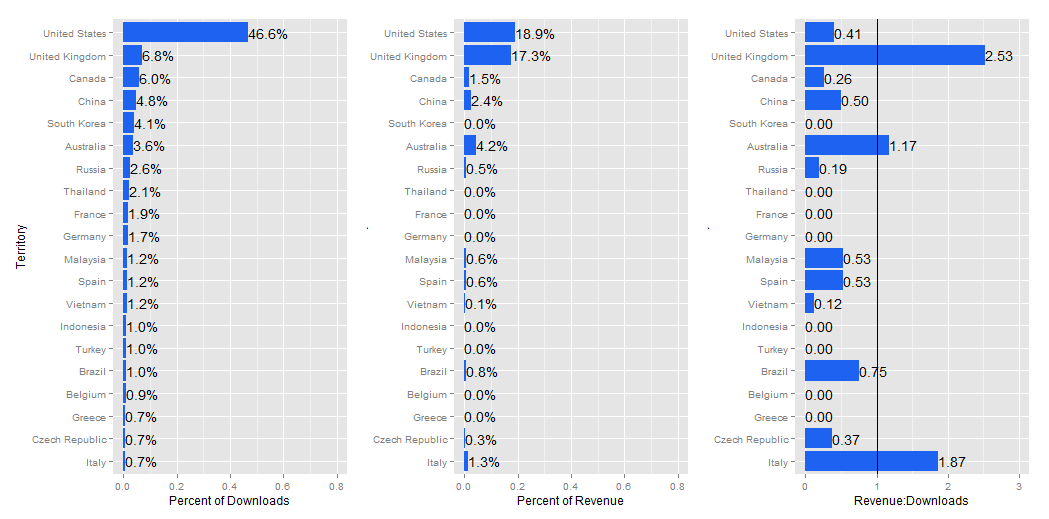 Figure 1 - Helitack Downloads, Revenue, and Relative Download Value (Tools – R, ggplot2, Sketch)
The United States generates the most downloads and the most revenue, as usual. This is, however, the first analysis in which the United States territory’s relative download value ratio is less than one. The charts here don’t look anything like those from our similarly-themed wildfire education app, Fight the Fire. The US typically generates 60%-80% of our total app revenue, but doesn’t even break 20% for Helitack. Revenues here are spread around among several countries.
What is behind this? Based on my previous findings from Fight the Fire, I don’t think it’s likely that Brits and Italians are just really into wildfire fighting games. AdMob was the biggest driver behind Helitack’s outsize ARPU numbers, so I suspected that delving deeper into our advertising data would yield some answers. I pulled the eCPM (revenue per thousand impressions) by territory from our AdMob advertising data. I don’t want to reveal our actual eCPM numbers at this time, so I created an eCPM index where the United States eCPM is indexed to a value of 100. Figure 2 shows the results from our top 15 territories.
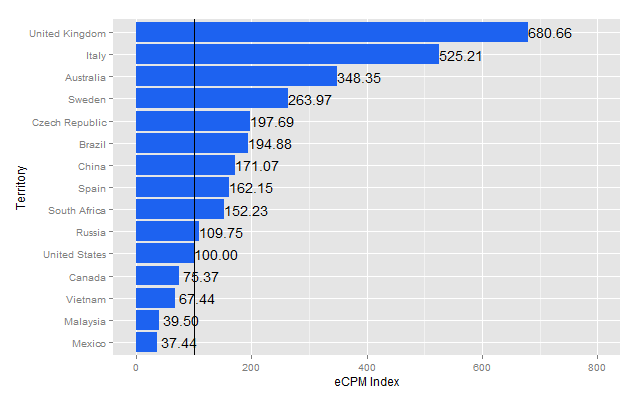
Figure 2 - Helitack eCPM Index by Territory (Tools: R, ggplot2)
Hypothetically, if Helitack AdMob interstitial ads in the United States generate $10.00 per thousand impressions, then the UK eCPM index of 680 means that ads in the UK generate $68.00 per thousand impressions. An ad impression in the UK is worth 6.8 times as much as one in the United States! The top three territories by relative download value– the UK, Italy, and Australia– are also the top territories by eCPM. The clickthrough rates in these three countries are all about 3 times higher than in the US, so even taking that into account, these territories are generating outsize revenues.
To be honest, I don’t really have a good idea why British, Italian, and Australian users are worth so much with AdMob in Helitack. We will be using AdMob interstitials in our next project, a personal finance RPG, so I will be able to see if this trend continues into other apps, or if it’s just an anomaly.
Please feel free to tweet any questions you might have to me @ZippyBrain.