Exploring App Store Page Conversion Rates
06 May 2015
Eric Fram
This article was originally posted on ZippyBrain.com on May 6th, 2015. Link
##Introduction##
As of today, we have access to Apple’s new iTunes Connect Analytics beta. I haven’t had a chance to explore all of the features, but one of the most useful and novel features is the ability to track how many pageviews our app’s App Store pages are getting relative to how many downloads those apps get. This has been possible for some time using link tagging/campaign URLs (here’s how Flurry implements it, as an example), but it’s great to finally have this feature natively supported by Apple. Link tagging has a few extra benefits, such as the ability to track user quality and conversion rates by acquisition channel, though with iTunes Connect Analytics, we can at least see our overall app store page conversion rates (where a download is a conversion). By comparing conversion rates for our apps’ App Store pages, we can get some insight into what works best so that we can create more effective app metadata (screenshots, videos, descriptions) in the future.
Figure 1 shows our App Store page conversion rates for seven of our top apps. “App Store Page Conversion Rate” is the percent of people who download the app after first visiting that app’s App Store page. Since iTunes Connect Analytics is a new platform, the data doesn’t go very far back (we’re just using the last 30 days here) and only includes users who are using iOS8.
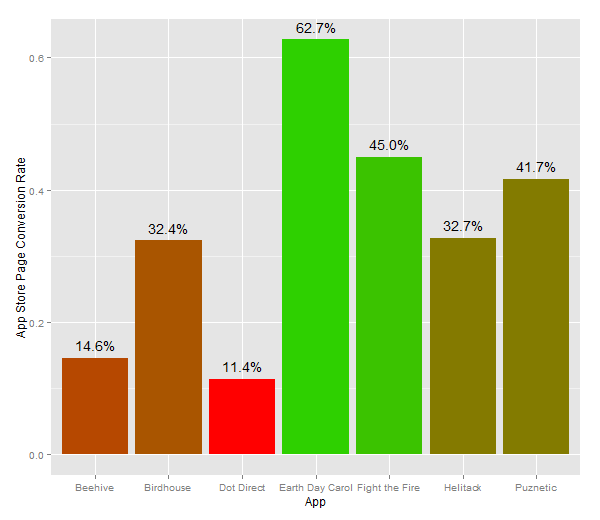
Figure 1 - App Store Page Conversion Rates by App, 6 Apr 15 to 6 May 15 (Tools: R, ggplot2)
Keep in mind that these figures only measure conversion rates once someone is already viewing the page. This is only one small part of App Store Optimization, and it probably one of the easiest. Getting people to even go to your App Store pages in the first place is really the bigger challenge.
Earth Day Carol - App Store Page Conversion Rate 62.7%
Earth Day Carol wins big here, but I think that this data may be skewed by the fact that Earth Day actually occurred during this measurement period. Earth Day consistently generates a big bump in downloads and general awareness for Earth Day Carol. I’ll check out these numbers again for the next 30 days and see if that changes anything. If it turns out to be the case that Earth Day Carol’s conversion rates spike during Earth Day, that means that any marketing our outreach efforts we conduct on that day will be more effective. This is pretty intuitive even without data, but it’s good to have some evidence to support that idea.
For now though, because I suspect that Earth Day is screwing with these numbers, I’ll put any analysis of Earth Day Carol’s conversion rates on hold.
Fight the Fire - App Store Page Conversion Rate 45%
After Earth Day Carol comes Fight the Fire, with a 45% conversion rate. In my opinion, Fight the Fire is our strongest App Store page, so I’m happy to see that it also seems to be one of our most effective. If you’re reading this on an iPhone or iPad, you will also be able to view the video App Preview from within the App Store. If you’re on something else, this is what is looks like (excluding the background):
Even without watching the video, you can get a good idea of how the game works from looking a the screenshots. They make it look interesting and exciting, especially since the gameplay includes a wide variety of bright colors and art.
Puznetic - App Store Page Conversion Rate 41.7%
I am surprised to see Puznetic come in so high in the rankings. It is one of our earlier apps, and looking back at the metadata we uploaded to the App Store page, I don’t think its our best work. We published the game before App Previews were available, and since the game never really took off, we have not taken the time to add one.
Compared to our screenshots for Fight the Fire, Puznetic’s are pretty homogenous. They do a good job showing how the game works, but I don’t think that they make it look very exciting. Users looking for jigsaw-type puzzles seem to be more forgiving than those searching in the more competitive casual game categories.
Helitack - App Store Page Conversion Rate 32.7%
Helitack’s conversion rate is the most disappointing for me, since I think it is a reasonably strong showing. The fact that it is a is a super casual endless runner-style game, and that the gameplay screen basically looks the same throughout the entire game definitely hurts us. You can see in the App Preview that the game basically looks the same all the way through:
It’s fun to play, but that doesn’t come across too well in the video. Without being disingenuous about what the game is actually like, I am not sure if we could represent the game too much differently. You can see that the screenshots suffer from the same issue… they’re all basically the same. They are even more homogenous than Puznetic.
On the other hand, we made Helitack in a little over 3 weeks by reusing art from our other games. Considering that, a >30% conversion rate seems okay.
If we decide to release an update, one of the top things I would include would be a greater variety of flying obstacles and a greater variety of background art. Just those cosmetic details will make the game more engaging and allow us to create vastly more interesting metadata.
Battle for the Birdhouse - App Store Page Conversion Rate 32.4% AND Beehive Blast - App Store Page Conversion Rate 14.6%
I’m lumping Birdhouse and Beehive together since Beehive is basically just a reskin of Birdhouse with a few extra features. The app descriptions and the screenshots are pretty similar for both apps. Neither set of screenshots offer much visual variety, but they are colorful and they do give a reasonably good idea of how the gameplay works.
And yet, the conversion rate for Birdhouse is twice that of Beehive.
With Beehive, we included banners across the top of the screen explaining how the game works. I don’t think that part hurts us. Perhaps the idea of helping bees get into their beehive just isn’t as interesting as helping birds get into a birdhouse. It might have something to do with our color choices for the background art. I will admit that the rich blue in the Birdhouse background for some reason seems more engaging that the pale sunset hues in Beehive. I suspect that color differences may be a significant part of the disparity between conversion rates. Different color choices are something that I plan to A/B test in our future apps, but at this stage, we just don’t have the time to go back and experiment with these two (as we have a big project in the works!)
Dot Direct - App Store Page Conversion Rate 11.4%
Dot Direct was our first casual game. The screenshots on its App Store page suffer from some of the same issues we have with other apps: they all look basically the same. As with Helitack, Beehive, and Birdhouse, it’s an endless runner that doesn’t change a lot from start to finish. The gameplay mechanics are reasonably fun, but that doesn’t come across very well in the metadata.
Just like with Helitack, if I were to take time to redesign the game, one of my biggest priorities would be to overhaul the art and expand the visual variety within the game (perhaps by changing the background or adding additional particles and directors). A better-looking game allows me to create better-looking metadata, and better metadata should mean better conversion rates.
The Takeaway
I understand that this is an unscientific analysis, but there are a few things we can learn from this analysis about optimizing App Store page conversion rates.
1 - Screenshots and videos that show lots of variety are better
Fight the Fire’s App Store page demonstrates the wide range of environments and gameplay mechanics that user can experience in the game. Our older apps, like Dot Direct, have screenshots that all look basically the same. As a result, Fight the Fire’s App Store conversion rate is 4 times higher.
2 - Visually exciting games ➔ more effective metadata
Even with our improved skills creating metadata, there isn’t a whole lot we could do to improve our App Store pages for games like Dot Direct. The games just aren’t that visually interesting. With a game like Fight the Fire, it was super easy to make interesting metadata.
3 - Small things can make a big difference
Beehive and Birdhouse has very similar screenshots and descriptions, but Birdhouse has twice the conversion rate. Little things like the color of the art in screenshots can make a huge difference in conversion rates. The only way to know what will work best is to test it.
Thanks for reading! As always, feel free to connect with me on twitter @ZippyBrain. In the near future, I plan to revisit some of this data to see if Earth Day Carol is really that great at converting people, to see if there are any big differences in conversion rates between platforms (iPhone vs. iPad), and to see if this data changes at all when I have several more months of data to work with.