Improved Segment Analysis – Do Local Notifications Increase Retention Rates?
05 Jun 2015
Eric Fram
This article was originally posted in ZippyBrain.com on June 5th, 2015. Link
Introduction
A couple months ago I posted an analysis that attempted to determine whether or not local notifications increase mobile app retention rates. Read it here. My methods with that analysis weren’t perfect, as I compared two similar apps - Beehive Blast and Battle for the Birdhouse - instead of segments of the same app. I now have better data, so I thought it would be worthwhile to re-do that analysis.
Instead of comparing two similar apps, I can now compare user segments of Fight the Fire. In Fight the Fire, we prompt users three times to approve notifications. Once at the completion of level 4, once at the completion of level 8, and once at the completion of level 12. We use Flurry custom events to anonymously track how many users approve or deny this prompt. Overall, about 15% of people who use Fight the Fire approve notifications. We could potentially change the way we ask for notifications to improve that number, but at this point we do have a big enough pool of users who have approved notifications to conduct this analysis.
I used Flurry’s segments feature to divide all users of Fight the Fire into two groups:
- Notification Approvers - 15% of Total Users
- Users that have triggered ANY of the following events:
- Notification Permission - YES from user at level 4
- Notification Permission - YES from user at level 8
- Notification Permission - YES from user at level 12
- Users that have triggered ANY of the following events:
- Notification Non-Approvers - 85% of Total Users
- Users that have NOT triggered ANY of the following events:
- Notification Permission - YES from user at level 4
- Notification Permission - YES from user at level 8
- Notification Permission - YES from user at level 12
- Users that have NOT triggered ANY of the following events:
As I cited in my previous analysis, mobile app industry averages last year for 1st/7th/30th day retention were just 14%/10%/4% (Source: Mack Flavelle at Tapstream). This means that after a user downloads an app, the chance that user opens the app the day after downloading it is just 14%. Not super great.
We’ve just released a big update to Fight the Fire (v3.0), but for this analysis I’m only going to include usage data from our previous version (v2.0).
Overall Retention
Fight the Fire’s over retention stats aren’t spectacular. 1st/7th/30th (well, 29th as that’s what Flurry gives me) day retention is 17%/2%/<1%. Figure 1 shows retention rates.
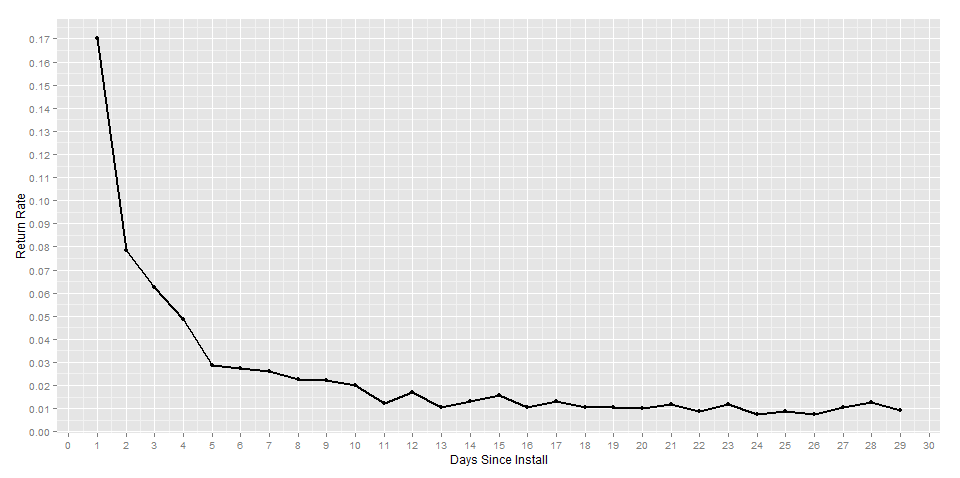
Figure 1 - Fight the Fire Overall Retention Rates | Tools: R, ggplot2
Retention by Segments
To get a look at whether or not users who approve notifications behave any differently, let’s now plot two lines. One line showing retention for Notification Approvers and one line showing retention for Notification Non-Approvers/Deniers. See Figure 2.
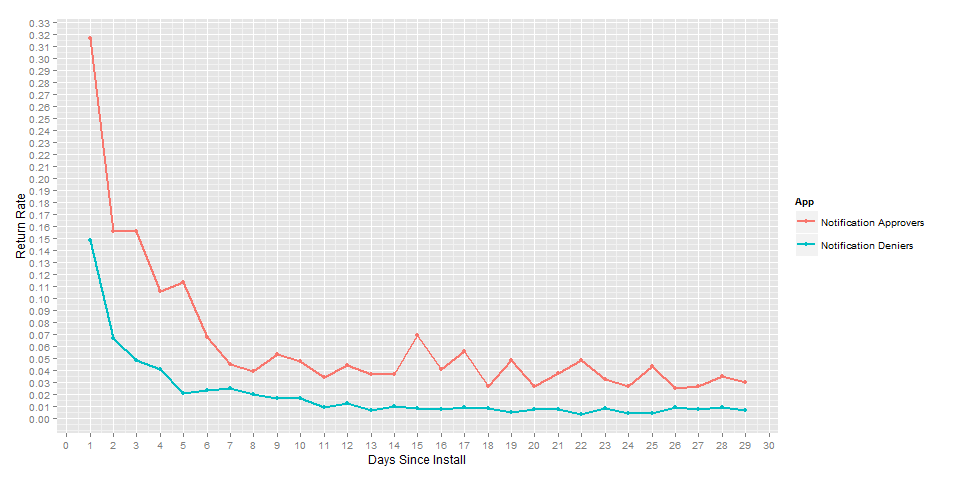
Figure 2 - Comparison of Retention Rate for Notification Approvers and Notification Non-Approvers | Tools: R, ggplot2
Notification Approver 1st/7th/29th day retention is 32%/5%/3%. Notification Non-Approver retention is 15%/2%/<1%. You can see in Figure 2 that Notification Approver retention rate is higher across the board.
Let’s perform a Wilcoxon (Mann-Whitney) test to see if the differences in retention rate are significant. See Figure 3 for the results.

Figure 3 - Wilcoxon test results comparing retention for Notification Approvers and Notification Non-Approvers | Tools: R
A p-value <0.05 means that we can be pretty sure the differences in retention rates between these segments is significant. The p-value here is 0.0000001234, so we can be nearly absolutely certain that the difference is significant. Let’s be honest, we already knew that just from looking at the chart in Figure 2 that users who approve notifications are far more likely to be retained.
What Does it Mean?
This analysis tells us that people who approve notifications are more likely to keep using the app. I recognize that this doesn’t answer the original question I asked, which is “do local notifications increase retention rates?”, but it’s still valuable information.
People who are okay with getting notifications and so approve them are likely to come back to an app that sends those notifications. People who don’t want notifications are probably going to ignore them. I think it’s likely that we continue to see increased retention from users who approve notifications. By presenting more compelling uses for notifications in future updates and projects (such as social interaction or time-based incentives), we’ll be able to get more users to approve them and hopefully increase overall retention rates.
As I said, this analysis is biased, and it doesn’t directly tell us if local notifications increase retention. A better way to structure the test would be to segment the notification approvers into a group that receives notifications and a group that never actually receives notifications. That way, we could compare those two groups and see if the notifications actually make a difference. Hopefully this is something we will have time to do in the future.
Thanks for taking the time to read this! If you have any questions or comments, please feel free to reach out to me or tweet at me @ZippyBrain.