WealthSim (The Personal Finance RPG) Update 3: Market Simulation
29 Jul 2015
Eric Fram
This article was originally posted in ZippyBrain.com on July 29th, 2015. Link
Introduction
As promised in Update 2, this post will explain the system we’ve developed to simulate different economic environments, including the markets for stocks, bonds, and gold. We’ve developed a system that simulates the market within a set of parameters. Every game will have different results, since many aspects of the simulation are based on randomness. This is both realistic and will make WealthSim much more replayable.
In the game, there are five different possible economic environments that do a reasonably good job of replicating full stock market cycles. The current economic situation in the game affects stock returns, gold prices, bond interest rates, loan rates, money market rates, and inflation. They are as follows:
- Consolidation/Accumulation, based roughly on the period from February 2009 to October 2009
- Upward Advancement/Bull Market, based roughly on the period from June 2006 to April 2007
- Culmination/Distribution, based roughly on the period from May 2007 to Dec 2007
- Decline/Bear Market, based roughly on the period from January 2008 to January 2009
- Stagflation, based roughly on the period from 1979 to 1984
The first 4 environments replicate a full stock market cycle. We included stagflation as a way to include a unique economic situation that can force players to significantly reconsider their strategies. We’ve built our system to be flexible, so we will be able to add or remove other types of economic environments as needed based on feedback.
The game uses the following table to pick which economic environment will occur next based on the “Percent Time” column. I will never pick the same one twice in a row. The number of turns each environment lasts is randomly picked from between that environment’s minimum and maximum length (each turn equals one month).
| Cycle No | Min Turns | Max Turns | Percent Time |
| 1 | 3 | 7 | 0.12 |
| 2 | 3 | 8 | 0.35 |
| 3 | 5 | 12 | 0.355 |
| 4 | 2 | 6 | 0.15 |
| 5 | 12 | 24 | 0.025 |
Each economic environment has it’s own table of possible values for stock returns, interest rates, etc, that I randomly generated within realistic parameters. I’m not going to show those here, since they are pretty big. The game will randomly pick values from the current environment’s table each turn.
Testing the Simulation
The simulation system we designed will produce realistic, but wildly different results for each game. Over the long term (so hundreds or thousands of turns), the investment returns of different asset classes are in line with their real-life counterparts. In the short term though, lots of interesting things can happen (just like real life).
I’ve run 20 years (240 turns) of the simulation five different times to demonstrate how it works. In the game, we have four asset classes: Stocks, Bonds, Gold, and Cash (Money Market). Each one behaves like a total market index fund, and all dividends and interest payments are automatically reinvested. We’ve chosen to simplify the market simulation in this way to make the game more accessible and reduce development time. Investors should be investing in index funds instead of individual stocks anyways.
In each simulation, I’ve started the game with $10,000 invested in each asset type. Over the simulations, the geometric average returns of our core asset classes come out like this (all in APR, with simulated inflation included for reference):
simNo</td>
| Avg. Inflation |
Avg. Stock Return |
Avg. Bond Return |
Avg. Gold Return |
Avg. Money Mkt. Return |
</tr>
sim1 |
0.029 |
0.161 |
0.077 |
-0.017 |
0.024 |
sim2 |
0.039 |
0.064 |
0.088 |
0.097 |
0.035 |
sim3 |
0.028 |
0.236 |
0.06 |
-0.043 |
0.022 |
sim4 |
0.043 |
0.077 |
0.069 |
0.116 |
0.043 |
sim5 |
0.027 |
0.136 |
0.068 |
-0.023 |
0.021 |
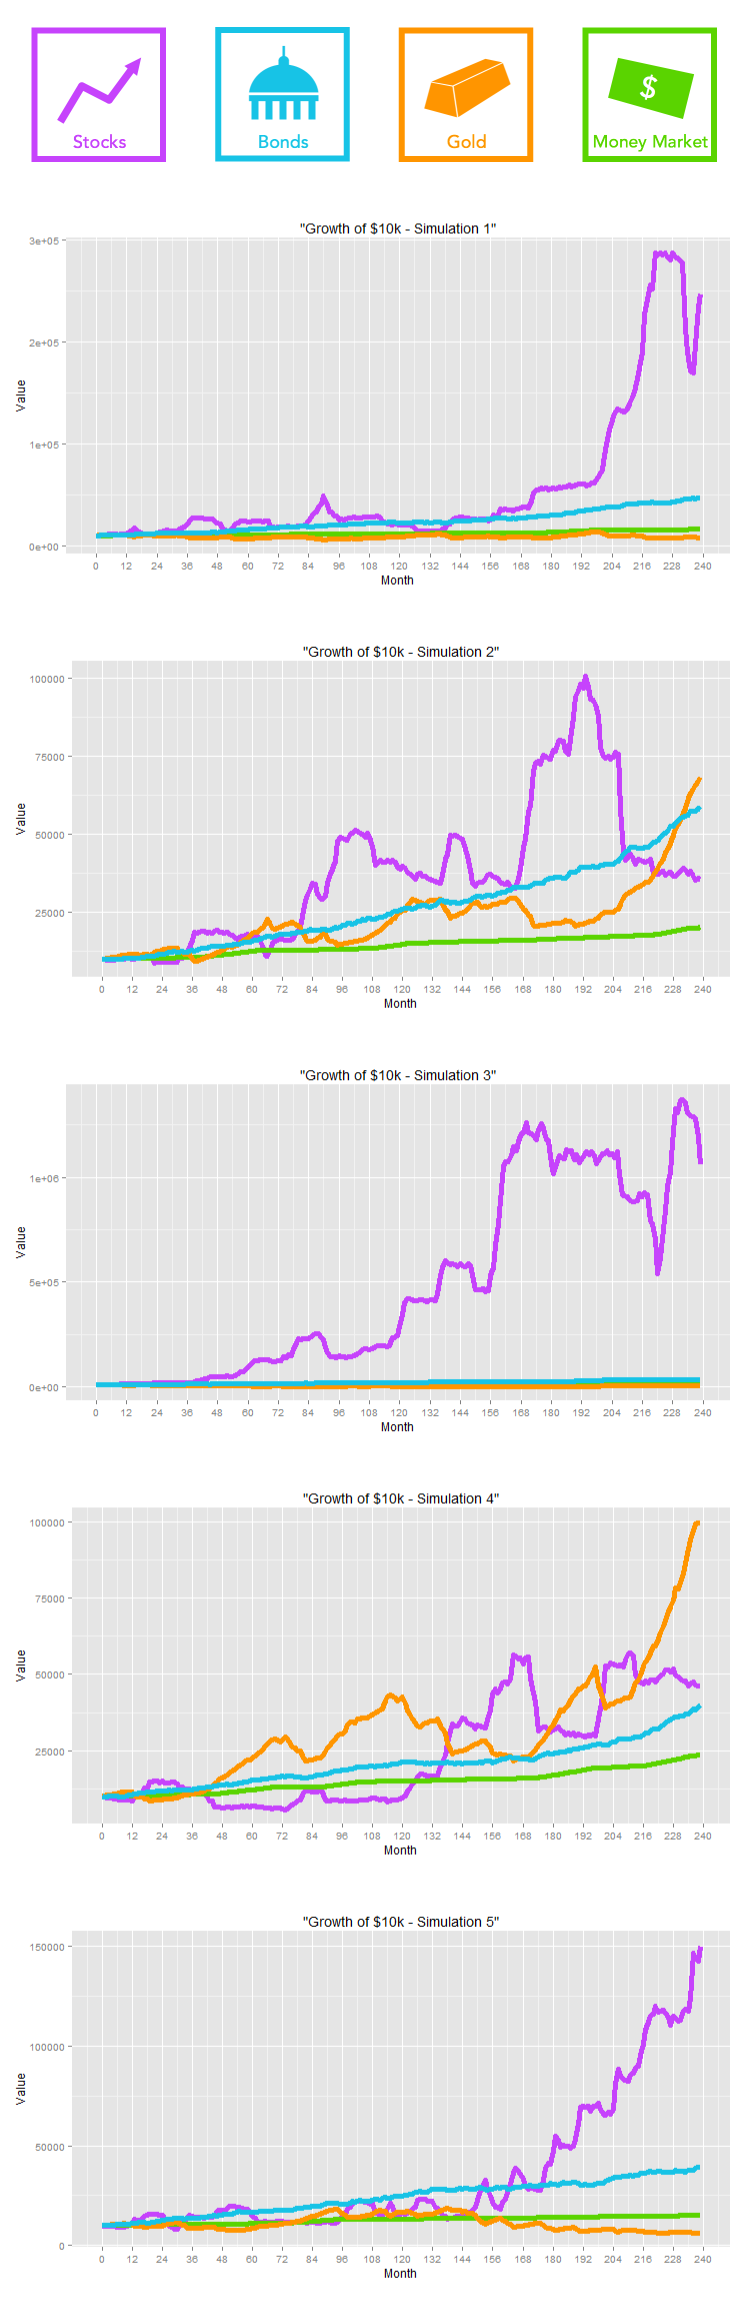 While the system is working, it still needs a few tweaks. You can see that sometimes the returns on stocks will end up being too high. Generally though, we're getting pretty close! These charts looks a lot like real financial returns charts!
Back to WorkThanks for checking out this update. WealthSim still needs some work before we are ready for user testing, but we're making very satisfying progress. Stay on the lookout for some more in-depth information about our simulation techniques. Please feel free to reach out with with any questions or comments to @ZippyBrain. |